![]()
یک رگرسیون گمراهکننده
31 خرداد 1388 ساعت 12:27
Statistical Report Purporting to Show Rigged Iranian Election Is Flawed
There is a statistical analysis making the rounds, however, which purports to show overwhelmingly persuasive evidence that the Iranian election was rigged. I do not find this evidence compelling.
Iran's election results were reported by its Interior Ministry in six waves. The first wave covered about one-third of the total vote; there were then two relatively large waves that reported about 20 percent of the vote each, and then three smaller waves that reported the remainder of the vote. What other observers have found is that, over the course of the six waves, there is an extremely strong, linear relationship between the number of votes reported for Ahmadinejad and the number reported for his principal opponent, Mir Hussein Moussavi (who had declared victory before any results were officially announced):
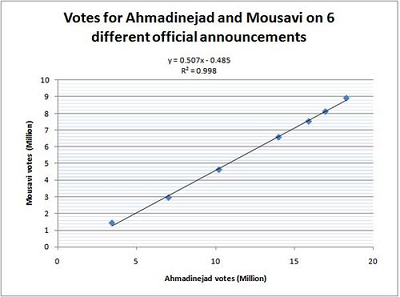
This relationship is superficially very impressive -- an R-squared of .998, which suggests a nearly perfect relationship.
Just how remarkable really is it, however? Rather than deal in abstractions, let's try a more concrete sort of experiment. Suppose that results from last November's election between Barack Obama and John McCain were revealed in this fashion, in six large waves. Suppose moreover that these waves were determined based on the alphabetical ordering of the states:
Wave 1: Results from Alabama-Illinois are reported; this represents about 33% of the total vote.
Wave 2: Results from Indiana-Mississippi (17% of the total vote) are added to the above totals.
Wave 3: Results from Missouri-North Carolina (19%) are added.
Wave 4: Results from North Dakota-Pennsylvania (12%) are added.
Wave 5: Results from Rhode Island-Texas (10%) are added.
Wave 6: Lastly, results from Utah-Wyoming (9%) are added and the counting is complete.
If results were released in this fashion, here is what we would get for the total number of votes for Obama and McCain at each stage:
Now, let's plot these on a graph:
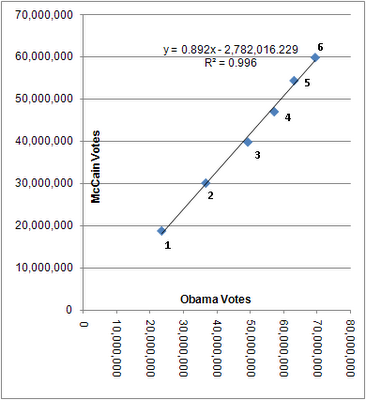
Wow! The correlation is extremely high -- an R-Squared of .9959 -- almost as high as the one we saw for Iran. Does that mean the U.S. election was rigged too?
Of course not. The apparently extremely strong relationship is mostly an artifact of the exceptionally simple fact that as you count more votes, both candidates' totals will tend to increase. In our example, Wave 5 happens to be a very good one for McCain: it contains the results from South Carolina, South Dakota, Tennessee and Texas -- four red states -- plus Rhode Island, which went for Obama but contains a tiny number of votes. And yet, the impact of Wave 5 is barely visible when the results are presented in this fashion.
Likewise, there was more wave-to-wave variation in the Ahmadinejad-Moosavi results than the statistical analysis I cited above seems to imply. Ignoring votes for minor candidates, Ahmadinejad won a high of 70.4 percent of the votes in Wave 1, and a low of 62.3 percent in the votes newly added in Wave 6. By comparison, Obama's share of the newly-added votes in our experiment ranged from 56.4 percent in Wave 3 to 44.7 percent in Wave 4. That's slightly more variance than we saw in the Iranian results but not much.
Source:
http://www.fivethirtyeight.com
ترجمه
تحلیلهای آماری مبنی بر تقلب در انتخابات ایران معیوب است
تحلیلی آماری ارایه شده است که از آن به عنوان مدرک تقلب در انتخابات ایران یاد میشود. این تحلیل قانعکننده نیست.
نتایج انتخابات توسط وزارت کشور ایران در شش زمان جداگانه اعلام شد. اولین بار اعلام، تقریبا یک سوم کل آرا را شامل میشد. بعد از آن دو بار اعلام نتایج انتخابات داشتیم که هر کدام تقریبا 20 درصد آرا را شامل میشدند و سرانجام سه بار اعلام نتایج دیگر داشتیم که باقیمانده آرای شمارش شده را شامل میشدند. بنابر تحلیلها، وجود رابطه خطی قوی میان آرای احمدی نژاد و رقیب اصلی او موسوی ( که قبل از انتخابات پیروزی خود را اعلام کرده بود) نشانگر تقلب در انتخابات ایران است.
ضریب رگرسیونی بالا (R2 = 0.998) نشاندهنده یک رابطه تقریبا کامل است.
این مساله تا چه اندازه واقعا قابل توجه است. اجازه بدهید بر تجاربمان متمرکز شویم. فرض کنید که نتایج انتخابات نوامبر ایالات متحده بین باراک اوباما و جان مککین به همان ترتیب انتخابات ایران در شش مرتبه اعلام شود. فرض کنید که این نتایج به ترتیب الفبایی ایالتهای مختلف اعلام شود.
دفعه اول: نتایج آلاباما تا ایلینوی گزارش میشود. این مرحله 33 درصد آرا را شامل میشود.
دفعه دوم: نتایج ایندیانا تا میسیسیپی اعلام میشود. 17 درصد دیگر
دفعه دوم: نتایج میسوری تا کارولینای شمالی اعلام میشود. 19 درصد دیگر
دفعه دوم: نتایج داکوتای شمالی تا پنسیلوانیا اعلام میشود. 10 درصد دیگر
دفعه دوم: نتایج یوتا تا ویومینگ اعلام میشود. 9 درصد باقیمانده
اگر نتایج به این ترتیب اعلام شود، شکل زیر را برای کل آرای رقابت اوباما - مک کین خواهیم داشت. R2 = 0.996
آیا این نشان میدهد که در انتخابات ایالات متحده تقلب صورت گرفته است؟
البته که نه. این رابطه ظاهرا قوی تنها به خاطر این واقعیت ساده است که هرچه قدر رای های بیشتری شمرده میشود، جمع کل آرای دو نامزد هم افزایش مییابد. در مثال ما، در بار پنجم اعلام آرا که یک نتیجه خیلی خوب برای مک کین است و آرای کمی به اوباما تعلق گرفته است، این مرحله در نمودار به چشم نمیآید.
به همین ترتیب در مورد واریانس اعلام نتایج از یک دفعه به دفعه دیگر نیز میتوان به صورت بالا اعلام نظر کرد. با چشم پوشی از آرای نامزدهای دارای آرای کم، آرای احمدی نژاد در بار اول 70.4 و در بار ششم، 62.3 درصد بوده است. اگر با مورد امریکا مقایسه کنیم، آرای اوباما در دفعه سوم اعلام نتایج، 56.4 درصد و در دفعه چهارم 44.7 درصد بوده است که البته اندکی از واریانس نتایج ایران بیشتر بوده است.
مرتبط
A Misleading Curve - منحنی گمراهکننده
انحراف معیار آرای اعلام شده مشکل دار بود؟
کد مطلب: 47955
آدرس مطلب: http://alef.ir/vdcjihex.uqeaizsffu.html?47955